Here’s the true story of a company – let’s call them Integrated Financial Solutions (IFS) – and how they increased sales revenue by 30% and decreased costs by nearly as much.
IFS had a Sales Team of 60 people, with 5 dedicated Analysts and 3 Managers. Even though there were some territory/qualification rules in place, each lead could go to one of about 40 people on the team.
As with all sales teams, you had the stratospheric achievers – in this case guys like Thomas (who seemed to defy gravity itself with his ridiculous monthly numbers). And, of course, the just-good-enough-to-not-get-fired crowd, like Douglas.
In a typical month, Thomas would out-produce Douglas by a ridiculous measure of 4-to-1. IFS’ three Managers lamented nightly about why they “couldn’t just clone Thomas”.
Disclaimer – the Managers figuring out how to clone Thomas is not how they boosted revenue.
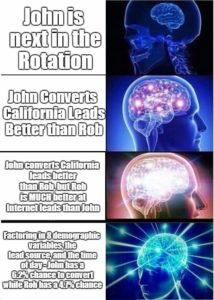
First There was Round Robin
It seemed like the fairest solution. Everyone received the same number of leads, and the process could justifiably be called “entirely random” (even though the managers were steering the best leads to Thomas in the background to keep him happy).
And yet, the Analysts knew there had to be a better way. So they dug into the data and started to find patterns. For starters, their biggest driver of lead diversity appeared to be Geography. Each state or territory closed at wildly different rates. So they began to draw some lines.
Then There were New Rules
California leads closed at 5.8%. If you weren’t batting at least 5.5%, you now weren’t getting California leads. Thomas had above-average numbers in all states, but those in the Douglas tier suddenly lost half of their eligibility. Nonetheless, there were still plenty of leads to go around – and revenue increased by 8%.
These rules were reviewed every 6 weeks, and adjustments made as necessary. That is, until the Managers told the Analysts to double down on the strategy.
Rules become Algorithms
The problem was that it was a complicated equation. If a middle-of-the-pack Salesperson named Susan closed an Internet California lead, was it because she does well on Internet leads or California leads? What about the other ten variables attached to every single lead?
So the Analysts picked what they decided were the 3 strongest variables and built an algorithm around them.
And so when an Internet California lead came in, the algorithm got to churning; if Thomas does 2% better than Susan on California leads, but Susan does 4% better on Internet leads, the lead went to Susan.
This new approach required the hiring and training of another FTE (Analyst) and Systems Administrator, but it was more than paid for by the marginal 10% boost in revenue from the previous method.
Algorithms Become A.I.
The algorithm, however, was entirely retrospective. It required manual updating, and was always about three months behind the curve. And while both the Analysts and Managers were incredibly proud of its success – they knew that it wasn’t capturing everything in the data.
So when they had the opportunity to upgrade to a Machine Learning/Artificial Intelligence solution, it was less a question of “if” than “when”. The result? A system that could factor far more variables than manual analysis. In real time. And adjust/improve automatically.
The A.I. solution sent Thomas the opportunities he had a major comparative advantage with, and even found slices of leads that Douglas performed in the 95th percentile on.
18% revenue gains became 30%. And countless hours of Analyst + Manager bandwidth was freed up for other productive tasks.
Bonus:
Perhaps the most interesting twist, once all of the numbers were crunched, was WAR distribution. WAR – or Wins Above Replacement is a metric of how many more/less deals closed (or Revenue) a Salesperson generated than what the AVERAGE Salesperson on the team would have with the exact same leads.
To accurately calculate WAR – you need to be able to quantify every single variable attached to a lead and know it’s real % chance to close (not the Best/Good/Bad lead scores most systems use). This way, it takes into account who is getting the easy leads versus the not-so-easy leads.
In the end, it turned out that Thomas, with his 14.8 WAR, wasn’t the #1 person on the team. Instead, with 16.8 WAR, the top Salesperson at Integrated Financial Solutions was……
……………….drum roll………………….
Susan!
Recent Comments